Singapore’s private property Q2 2025 analysis reveals 1% price growth, CCR hitting a record high of $3,380 PSF, a surge in the resale market, and rental stabilisation. Expert market insights.
Singapore Private Property Market Q2 2025 Overview
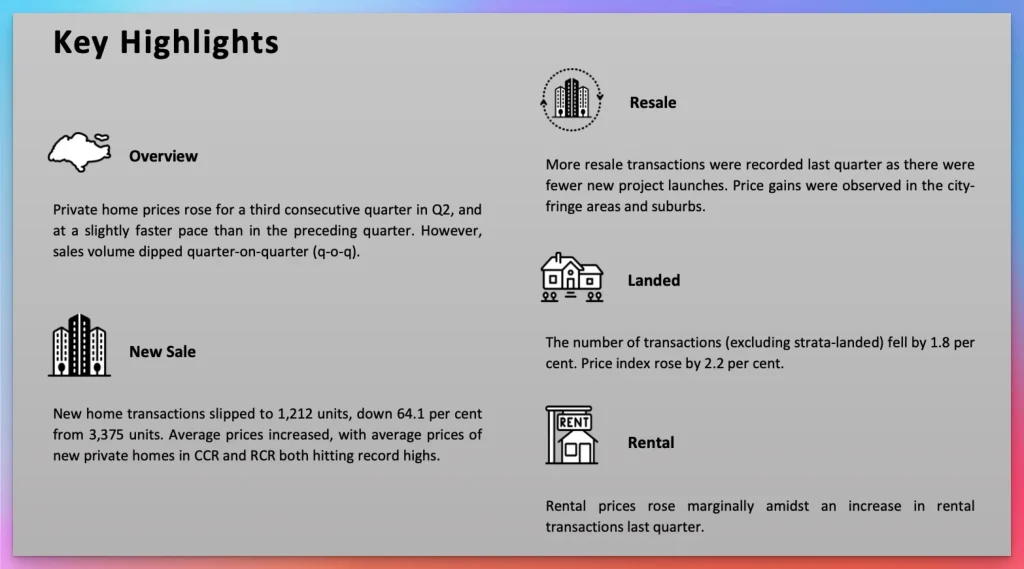
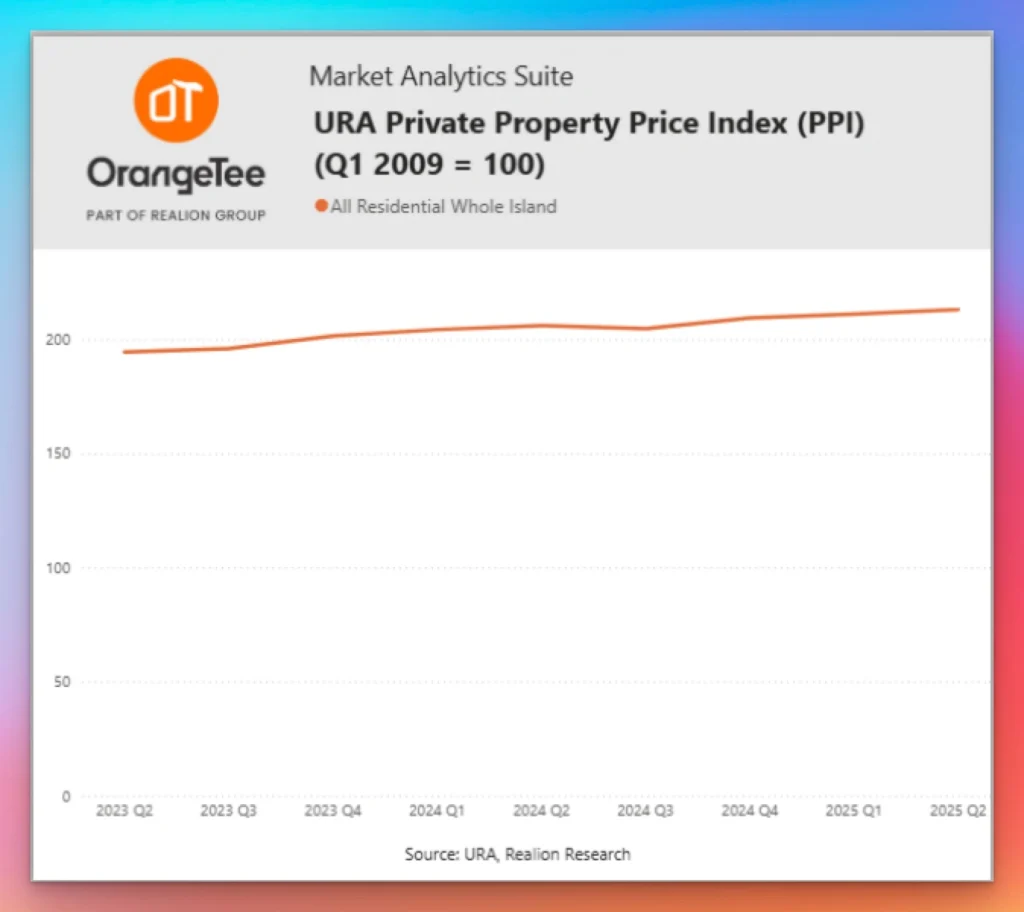
The Singapore private residential market demonstrated remarkable resilience in the second quarter of 2025, with property prices rising for the third consecutive quarter despite a notable decline in transaction volumes. This comprehensive analysis reveals critical trends, pricing dynamics, and investment opportunities across all market segments.
Key Market Performance Indicators Q2 2025
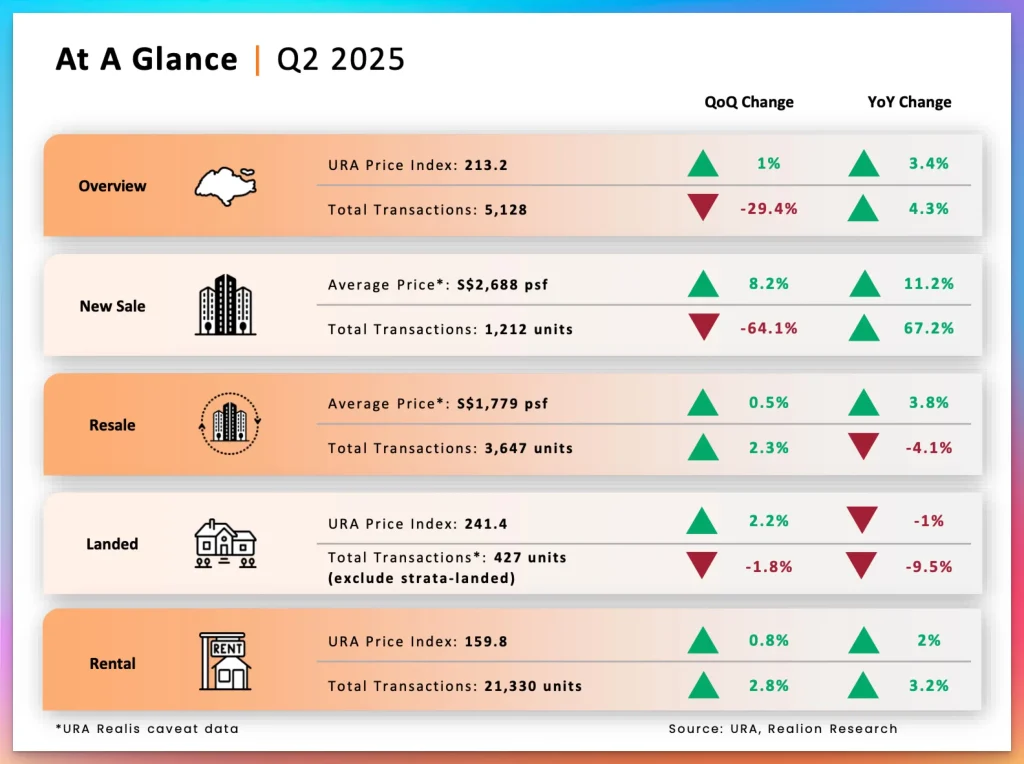
- Private home prices increased 1% quarter-on-quarter, accelerating from 0.8% in Q1 2025
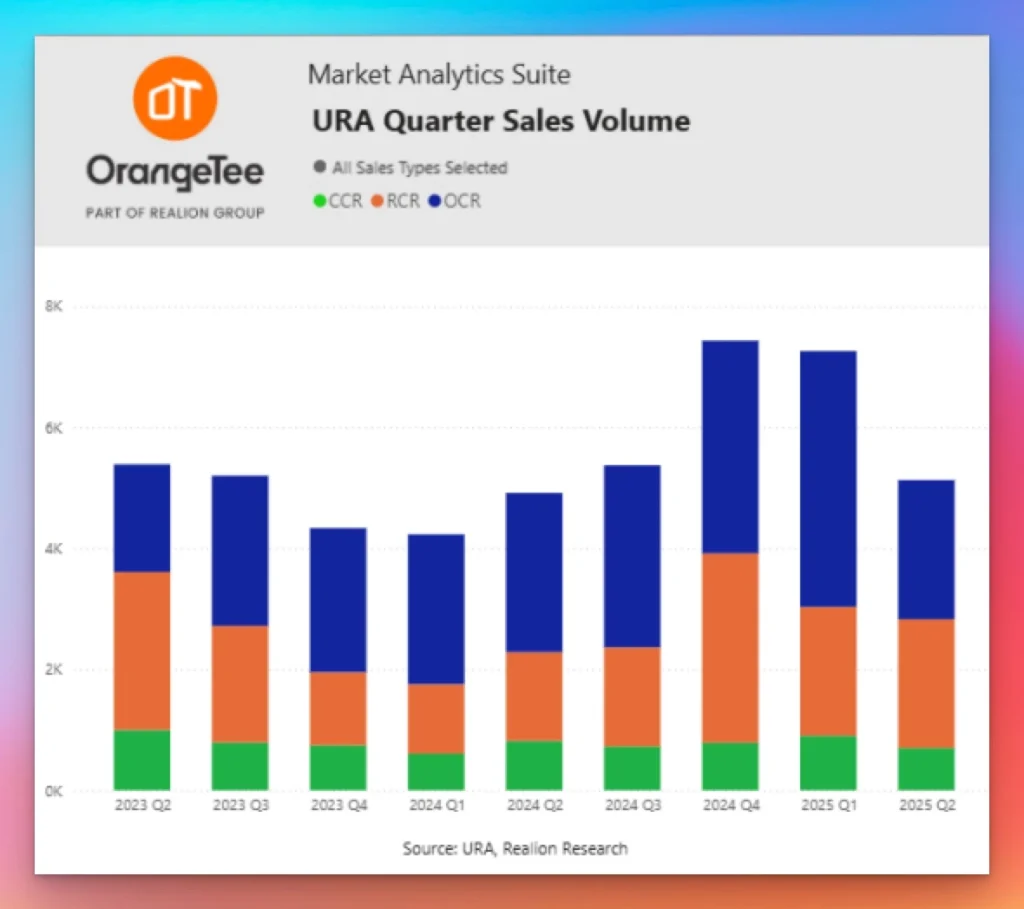
- Total transactions dropped 29.4% to 5,128 units from 7,261 units in Q1 2025
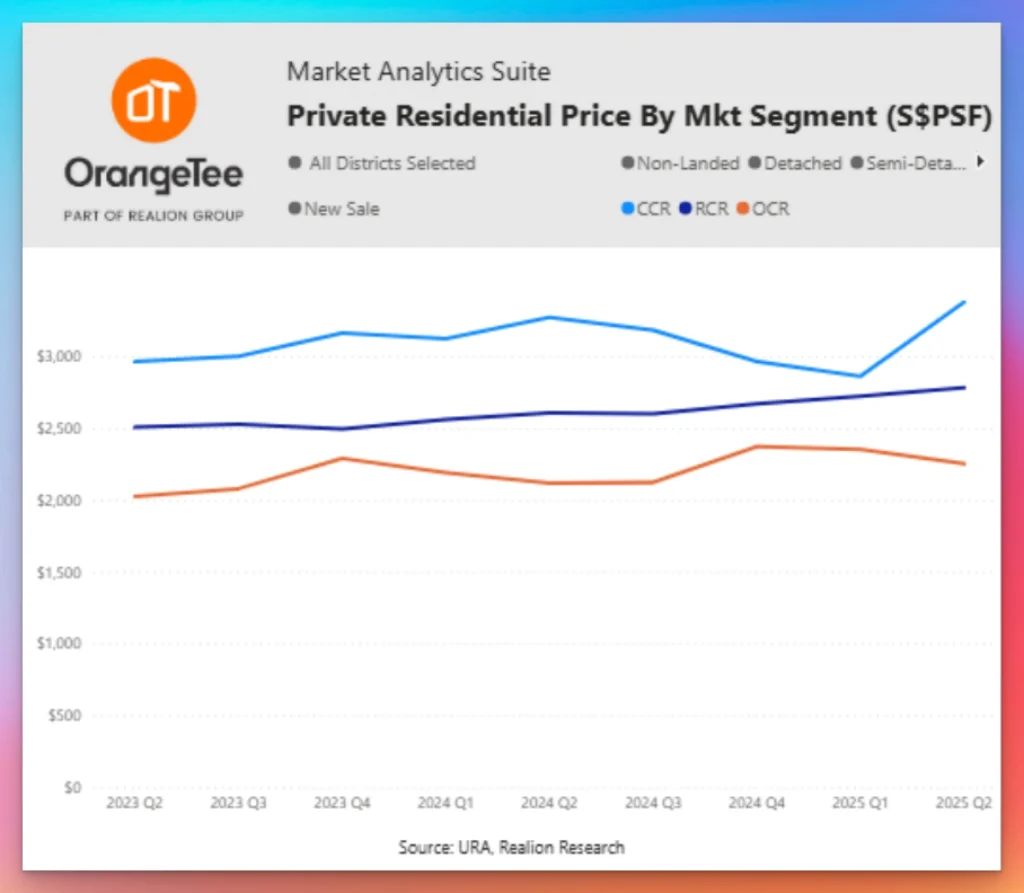
- New sale average prices hit a record high at $2,688 PSF across all segments
- CCR new sale prices surged to $3,380 PSF, marking an 18.1% quarterly increase
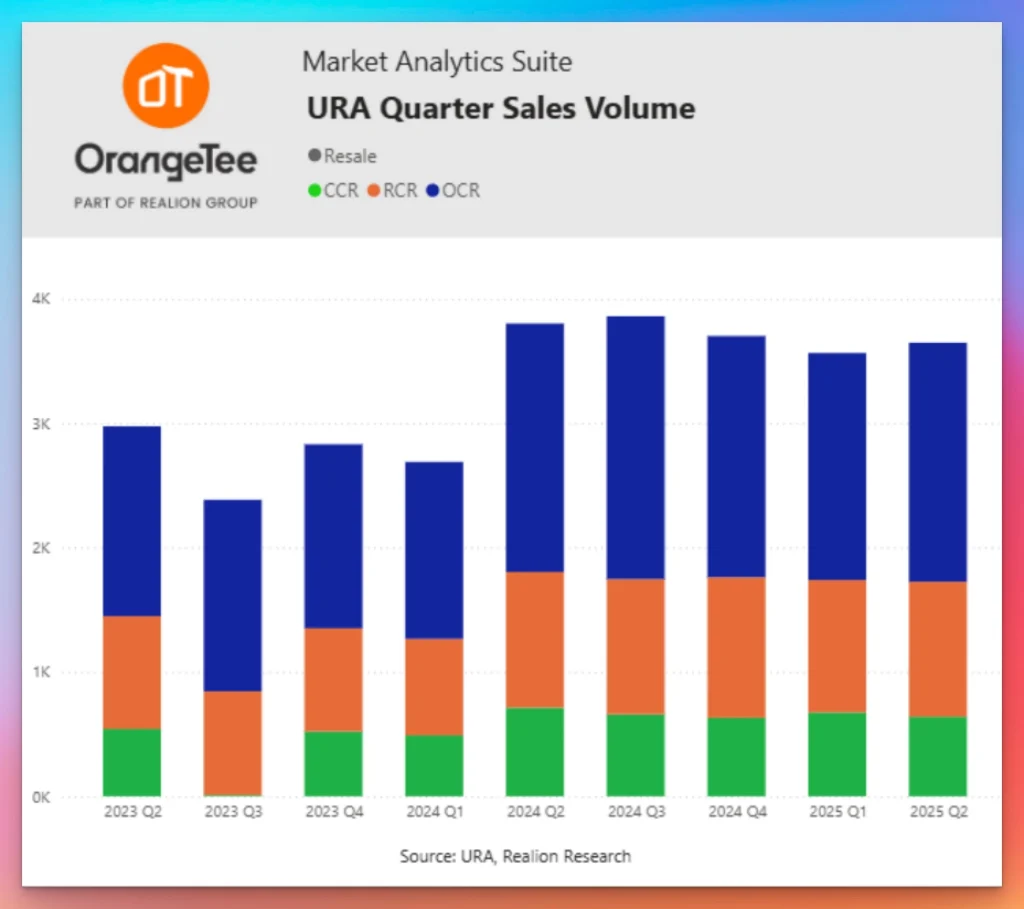
- Resale market gained momentum with 3,647 transactions, up 2.3% from the previous quarter
- Rental prices stabilised with modest 0.8% growth, marking the fifth consecutive quarter within ±1%
Core Central Region (CCR) Property Market Analysis
Record-Breaking Price Performance
The CCR segment led market growth with non-landed properties rising 3% quarter-on-quarter, driven by premium transactions exceeding $4,000 PSF. Notable high-value transactions included:
Ultra-Premium Transactions ($4,000-$6,000+ PSF):
- 7 units transacted between $4,000-$5,000 PSF (6 non-landed, 1 landed)
- 3 units sold between $5,000-$6,000 PSF
- 1 unit exceeded $6,000 PSF
Luxury Projects Leading Sales:
- Sculptura Ardmore: Premium transactions above $5,000 PSF
- Skywaters Residences: Trophy units commanding top dollar
- 21 Anderson: Consistent ultra-luxury performance

CCR Market Dynamics Q2 2025
New Sale Performance:
- Average price: $3,380 PSF (record high)
- Quarter-on-quarter growth: +18.1%
- Strong investor confidence in prime locations
Resale Activity:
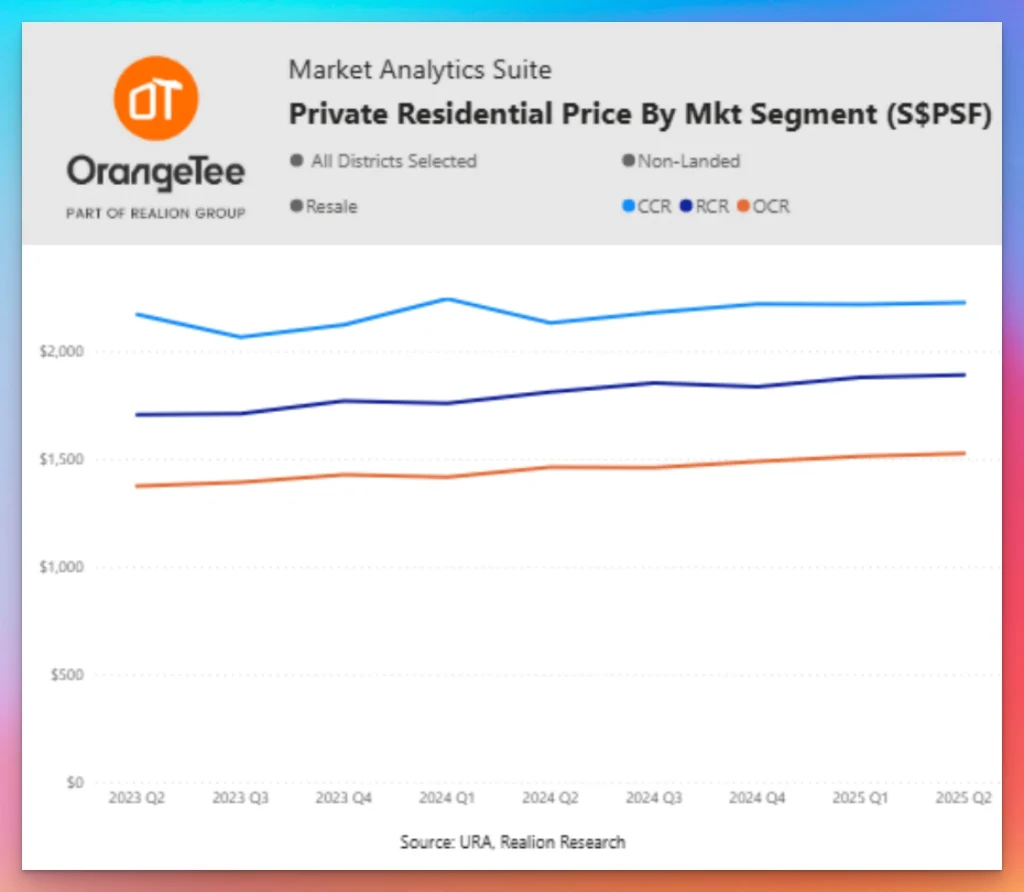
- Average price: $2,214 PSF
- Slight decline of -0.2% reflecting market recalibration
- 640 resale units transacted (down from 675 in Q1)
Rest of Central Region (RCR) Market Trends
City Fringe Resilience
The RCR demonstrated solid fundamentals with new sale prices reaching a record high of $2,782 PSF, representing a 2.2% quarterly increase. This performance reflects continued investor confidence in city fringe locations.
RCR Performance Highlights:
- New sale average: $2,782 PSF (record high)
- Resale average: $1,914 PSF (+1.1% growth)
- Transaction volume: 1,086 resale units (up from 1,064 in Q1)
- Overall market growth: +1.6% quarter-on-quarter
Resale Market Strength: The RCR resale market showed particular vitality with non-landed properties reaching a record high of $1,892 PSF, indicating strong underlying demand and limited supply dynamics.
Outside Central Region (OCR) Property Analysis
Suburban Market Dynamics
The OCR exhibited mixed performance with new sale prices declining to $2,252 PSF (-4.2% quarterly), while resale prices continued their upward trajectory to $1,563 PSF (+1.2% growth).
OCR Key Metrics:
- Resale transactions: 1,921 units (increased from 1,826 in Q1)
- Resale price milestone: $1,527 PSF for non-landed properties (record high)
- Market activity: Increased buyer interest in suburban locations
Table 1: Avg prices S$PSF (landed+non-landed exclude EC) for Q2 2025
Core Central Region (CCR)
| Type of Sale | Q1 2025 | Q2 2025 | QoQ % change |
|---|---|---|---|
| New Sale | $2,863 | $3,380 | 18.1% |
| Resale | $2,218 | $2,214 | -0.2% |
| Sub Sale | $2,943 | $3,044 | 3.4% |
| Overall | $2,389 | $2,311 | -3.3% |
Rest of Central Region (RCR)
| Type of Sale | Q1 2025 | Q2 2025 | QoQ % change |
|---|---|---|---|
| New Sale | $2,721 | $2,782 | 2.2% |
| Resale | $1,893 | $1,914 | 1.1% |
| Sub Sale | $2,210 | $2,229 | 0.9% |
| Overall | $2,274 | $2,309 | 1.6% |
Outside Central Region (OCR)
| Type of Sale | Q1 2025 | Q2 2025 | QoQ % change |
|---|---|---|---|
| New Sale | $2,351 | $2,252 | -4.2% |
| Resale | $1,545 | $1,563 | 1.2% |
| Sub Sale | $1,957 | $1,913 | -2.3% |
| Overall | $1,979 | $1,661 | -16.1% |
Total (CCR+RCR+OCR)
| Type of Sale | Q1 2025 | Q2 2025 | QoQ % change |
|---|---|---|---|
| New Sale | $2,485 | $2,688 | 8.2% |
| Resale | $1,770 | $1,779 | 0.5% |
| Sub Sale | $2,172 | $2,146 | -1.2% |
| Overall | $2,116 | $2,018 | -4.6% |
Singapore New Launch Property Market Q2 2025
Limited Supply Drives Premium Pricing
Despite fewer project launches, new sale prices across all segments hit fresh highs with the overall average reaching $2,688 PSF, marking an 8.2% quarterly increase.
New Launch Highlights:
- 5 new project launches in Q2 2025
- 51.6% decline in launched units quarter-on-quarter
- Seasonal factors: June school holidays impacted launch timing
Top-Performing New Launch Project
One Marina Gardens dominated Q2 2025 new sales:
- 479 units sold (approximately 40% of total new sales)
- Average price: $2,951 PSF
- Strong market reception demonstrating buyer appetite
Other Notable Projects:
- Promenade Peak: Premium location appeal
- Springleaf Residence: Suburban luxury segment
- The Orie: City fringe positioning
Singapore Resale Property Market Performance
Record-Breaking Resale Prices
The resale market achieved significant milestones with average prices hitting a record high of $1,779 PSF, representing 0.5% quarterly growth and 3.8% year-on-year appreciation.
Resale Market Segmentation:
- Landed properties: $1,863 PSF (record high)
- Non-landed properties: $1,766 PSF (record high)
- Total transactions: 3,647 units (+2.3% from Q1)
Price Gap Dynamics
The persistent price gap between new and resale properties continues driving resale price appreciation as:
- Property owners adjust asking prices upward
- High replacement costs influence pricing strategies
- Limited resale stock maintains upward pressure
Supply Constraints:
- 2025 estimated completions: 4,949 units (down from 8,460 in 2024)
- 2024 completions: 8,460 units
- 2023 completions: 19,968 units
reached record levels in CCR and RCR | Source: URA, Realion Research
Landed Property Market Analysis Singapore
Sustained Growth Momentum
The landed property segment showed robust price growth of 2.2% in Q2 2025, marking the highest growth since Q1 2024 when prices increased 2.6%.
Landed Market Metrics:
- Transaction volume: 427 units (excluding strata-landed)
- Quarterly decline: Slight drop from 435 units in Q1
- Historical context: Above 3-year average of 389 units
Good Class Bungalow (GCB) Surge
GCB transactions experienced dramatic growth, increasing from 2 units in Q1 to 9 units in Q2 2025, representing a 350% quarterly increase and demonstrating strong interest from ultra-high-net-worth investors.
GCB Market Drivers:
- Interest rate moderation supporting luxury purchases
- Capital preservation strategies amid global uncertainties
- Economic cycle resilience of trophy assets
Singapore Property Rental Market Q2 2025
Rental Stabilisation Continues
The private rental market maintained stability with 0.8% growth in Q2 2025, accelerating slightly from 0.4% in the previous quarter while remaining within the established ±1% range for the fifth consecutive quarter.
Rental Performance by Segment:
- Non-landed properties: +0.8% (up from +0.5% in Q1)
- Landed properties: +0.7% (up from +0.3% in Q1)
- CCR non-landed: +1.8% (fastest growth segment)
- RCR non-landed: Unchanged in Q2
- OCR non-landed: +0.1% (modest growth)
Rental Volume and Occupancy Trends
Transaction Activity:
- Total rental transactions: 21,330 units (+2.8% from Q1)
- Year-on-year growth: +3.2% from 20,676 units in Q2 2024
- Seasonal strength: Q2 typically shows higher rental activity
Occupancy Dynamics:
- Q2 2025 occupancy rate: 92.9% (down from 93.5% in Q1)
- CCR vacancy rate: 10.7% (highest among segments)
- RCR vacancy rate: 7.2%
- OCR vacancy rate: 5.6% (most stable)
Market Outlook and Investment Opportunities
Second Half 2025 Projections
New Project Pipeline: Several premium developments scheduled for launch in H2 2025, including projects in:
- River Valley: Prime waterfront locations
- Zion Road: Central connectivity advantages
- Desirable CCR locations: Meeting pent-up demand
Interest Rate Environment Impact
Favourable Financing Conditions:
- 3-month SORA decline: 50 basis points in Q2 2025
- Consistent downward trend: Similar declines in Q1 2025 and Q4 2024
- Buyer support: Improved affordability for first-time buyers and investors
Annual Market Projections
Price Growth Forecasts:
- Overall price appreciation: 3-5% for full year 2025
- Transaction volume estimate: 21,000-24,000 private homes (excluding EC)
Segment-Specific Projections:
- New sale price growth: 7-8% annually
- Resale price growth: 4-5% annually
- Rental growth: 0-2% annually
Investment Strategies Singapore Property 2025
Prime Location Focus
CCR Investment Opportunities:
- Record pricing reflects long-term value proposition
- Limited land supply supporting price stability
- Ultra-luxury segment showing consistent demand
City Fringe Value Play
RCR Strategic Positioning:
- Record resale prices indicate strong fundamentals
- Balanced supply-demand dynamics
- Accessibility to CBD and amenities
Suburban Growth Potential
OCR Market Opportunities:
- Increased transaction volumes suggest buyer interest
- Record resale prices in the non-landed segment
- Value proposition for families and upgraders
Risk Factors and Market Considerations
Global Economic Uncertainties
Potential Headwinds:
- Geopolitical tensions: Impact on international buyer sentiment
- Trade war implications: Affecting expatriate employment
- Macroeconomic volatility: Influencing investment decisions
Market Adaptation Strategies
Buyer Considerations:
- Price sensitivity: Increased selectivity in the current market
- Location prioritisation: Focus on proven submarkets
- Timing optimisation: Leverage favourable financing conditions
Overall
| Indicators | 2022 | 2023 | 2024 | Q1 2025 | Q2 2025 | H1 2025 | 2025 Projection |
|---|---|---|---|---|---|---|---|
| URA Property Price Index (Price Change) | 8.60% | 6.80% | 3.90% | 0.80% | 1% | 1.80% | 3% to 5% |
| Sales Volume (units) | 21,890 | 19,044 | 21,950 | 7,261 | 5,128 | 12,389 | 21,000 to 24,000 |
New Sale
| Average S$PSF (Price Change)* | 12.50% | 9.70% | -1.90% | -2.80% | 8.20% | 5.10% | 7% to 8% |
| Sales Volume (units) | 7,099 | 6,421 | 6,469 | 3,375 | 1,212 | 4,587 | 8,000 to 9,000 |
Resale
| Average S$PSF (Price Change)* | 8.70% | 7.50% | 5.10% | 1.40% | 0.50% | 1.90% | 4% to 5% |
| Sales volume (units) | 14,026 | 11,329 | 14,053 | 3,565 | 3,647 | 7,212 | 12,000 to 14,000 |
Rental
| URA Rental Index (Price Change) | 29.70% | 8.70% | -1.90% | 0.40% | 0.80% | 1.20% | 0% to 2% |
| Leasing volume (units)* | 90,291 | 82,268 | 86,476 | 20,744 | 21,330 | 42,074 | 80,000 to 82,000 |
Singapore Property Market FAQ
What drove CCR price growth in Q2 2025?
CCR price growth was driven by premium transactions above $4,000 PSF, with 11 high-value units transacted between $4,000-$6,000+ PSF, including trophy properties from projects like Sculptura Ardmore and Skywaters Residences.
Why did transaction volumes decline despite price growth?
The 29.4% decline in transactions was primarily due to fewer new project launches (down 51.6%) during the June school holiday period, when developers typically hold back launches and buyers are overseas.
Are resale properties still attractive investments?
Yes, resale properties achieved record prices of $1,779 PSF with strong fundamentals including limited supply (only 4,949 estimated completions in 2025), persistent new-resale price gaps, and tight inventory supporting continued appreciation.
What’s the rental market outlook for 2025?
The rental market shows stabilisation with modest 0-2% annual growth expected, supported by gradual economic recovery but tempered by cautious expatriate hiring amid global uncertainties.
Which market segment offers the best investment potential?
Each segment offers distinct opportunities: CCR for trophy assets and capital preservation, RCR for balanced growth and accessibility, and OCR for value-oriented investors seeking suburban lifestyle benefits.
About PropsBit.com.sg
PropsBit.com.sg delivers comprehensive Singapore property market analysis, investment insights, and exclusive listings across CCR, RCR, and OCR segments. Our experienced Jim Tan from OrangeTee & Tie agents provides personalised guidance for discerning buyers, sellers, and investors navigating Singapore’s dynamic real estate landscape.
Connect with our experts for exclusive market insights, investment strategies, and access to premium property opportunities tailored to your objectives.
Market Analysis Date: September 2025 | Data Sources: Urban Redevelopment Authority (URA), URA Realis, PropsBit Research Team
Disclaimer: Property investments carry risks. Past performance does not guarantee future returns. Consult qualified professionals before making investment decisions.